Learn more here.
Friday, December 17, 2010
Protecting Peruvian Waves
Posted by
Chad Nelsen
at
7:19 AM
|
![]()
Labels: peru, Save The Waves, surf protection, waves are resources
Wednesday, October 27, 2010
Surf Protection, World Surfing Reserves, Malibu and other Case Studies
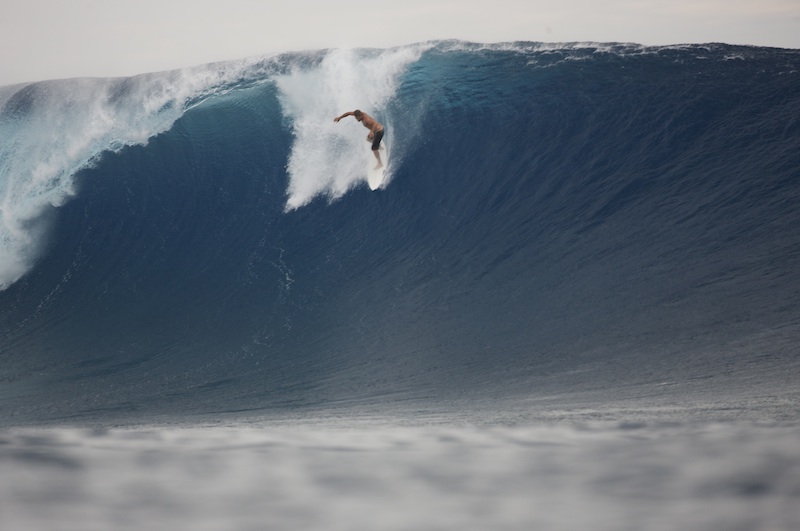 Big Day, Small Board: Erik "Frog" Nelsen dropping in at Cloudbreak, one of the world's iconic waves.
On October 9th, Malibu's famous Surfrider beach surfing areas was dedicated as the world's first World Surfing Reserve - an ambitious effort by a small NGO called Save the Waves.
The idea of protecting surfing areas and providing our iconic surfing spots around the globe protected status is something that is shared my many surfers as well as other NGO's that protect surf spots including the Surfrider Foundation USA, Europe, Japan, Argentina, Canada, WildCoast, Surfers Against Sewage, and others.
Here's a recent presentation I have on the topic of surf protection, the role of world surfing reserves in protecting surfing areas and some examples of surf protection efforts.
Surf Protection & World Surfing Reserves from Surfrider Foundation on Vimeo.
You can view and/or download the presentation here (Keynote).In addition here are a couple of recent articles discussing surfing reserves:
A critique of Malibu's world surfing reserve designation here.
An essay by Neil Lazarow entitled, "What is a Surfing Reserve and why should surfers care about them?"
Posted by
Chad Nelsen
at
6:03 AM
|
![]()
Labels: surf protection, world surfing reserves
Saturday, October 23, 2010
Perfect Anecdote: the wave value is so high...
File Under: Perfect Anecdote
The other day, I was walking down to Trestles for a lunch time surf (in the name of research of course!) and I had a nice chat with a guy who had cut out of work early to surf. He was from Manhattan Beach - so he had driven over 60 miles (one way) and then committed to the 20 minute walk down to the surf. We talked about quality of the waves, the crowds, etc. In response to the discussion about the crowds he said, "you may only get a couple of waves, but the wave value is so high that it's worth it".
So this guy was willing to drive 120 miles round trip, give up 1/2 a day of work, walk 40 minutes round trip, and brave the crowds at Trestles for a couple of hours in the water - all for one or two waves, because the value of those waves was so high - they were so much fun- it made it all worth it.
Posted by
Chad Nelsen
at
10:25 AM
|
![]()
Labels: consumer surplus, stoke, trestles
Thursday, September 30, 2010
Waves are Resources: WAR report from Surfer's Against Sewage
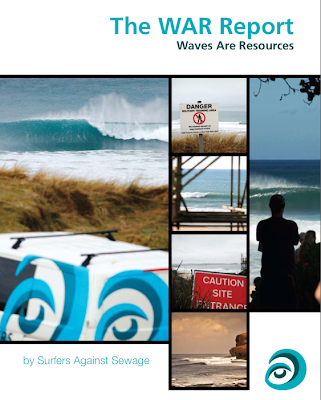
Surfer's Against Sewage released a new report called "Waves are Resources (WAR)".
The comprehensive report covers the basic physics of wave formation and breaking, efforts to value waves, activities that can impact waves (structures, dredging, pollution, oil spills, sewage, etc.), emerging efforts to generate power from waves and some of the efforts to protect waves, including World Surfing Reserves.
You can download and read the report here.
Posted by
Chad Nelsen
at
9:18 AM
|
![]()
Labels: surf protection, surfers against sewage, waves are resources
Wednesday, September 8, 2010
Posted by
Chad Nelsen
at
7:26 AM
|
![]()
Labels: california, CWO, ocean economy, shoreline armoring
Thursday, August 5, 2010
Gulf Coast Surfers Are Suffering, Too — And Health Risks Are Unclear
“You can’t see the oil anymore, but you can taste it,” said Mcelroy, who surfed again last week and whose surf shop is down over 70% in business from last year since tourism in Alabama is almost nonexistent.
Gulf coast surfers and surf-related business are suffering despite good surf conditions.
When surfing was closed along a mere 14 miles of coast for 34 days in Huntington Beach due to the American Trader oil spill, the value of the lost recreational opportunity (beach going & surfing) was valued at $18 million.
Read more here...
Posted by
Chad Nelsen
at
2:38 PM
|
![]()
Labels: American Trader, dispersant, gulf coast, oil, surfers
Friday, July 30, 2010
Five reasons why surfers are more likely to get sick from polluted ocean water than beach goers
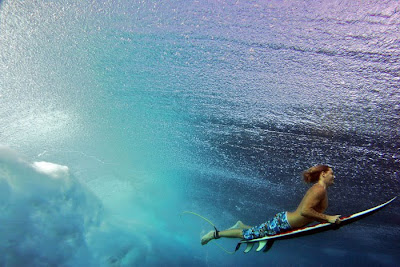
Any surfer who has leaned over to pick something up a few hours after surfing, only to suffer the embarrassment of having their nose drain all over the place, is a walking illustration of just how much ocean water surfers are exposed to when practicing their sport.
Here's a list of five reasons why surfers are more likely to get sick from polluted ocean water than other beach goers:
1. Surfers go to the beach & go in the ocean more than other beach goers
According to the 2001 Current Participation Patterns in Marine Recreation study, beach goers average 14 visits per year; in the same study surfers averaged 23 visits per year (Leeworthy and Wiley 2001).
Other studies in Oregon, California, and a national survey suggest surfer avidity is much higher. In Oregon, the average avidity was 77 visits/year (Stone et al. 2008). At Trestles, we found an average avidity of 109 visits/year (Nelsen et al. 2007). A pending Surf-First study found a average national avidity of 108 visits (unpublished).
2. Surfers recreate year round
Studies and common knowledge show that beach going is highly seasonal. Most visit occur during the summer months. Often more than half of the total visits occur during the 3 months of summer. In contrast, surfers tend to visit beaches and enter the water year round. In some places, surfers are the predominant beach visitor during winter months. This is significant because in the northern latitudes, winters tend to be more rainy than summer months, which increases the exposure to storm water runoff.
3. Every visit to the beach to surf results in full immersion in the ocean
According to Dwight et al. (2007) less than half of Southern California beach goers are exposed to ocean waters. And of those that are, many are not fully immersed in the water. Surfers, on the other hand, are fully immersed while surfing (see photo). This increases their exposure to pathogens if the water is polluted.
4. Surfers probably spend more time in the water on each visit
Surfers tend to surf between 1.5 and 2 hours surfing during each visit. Although I am not aware of any data, my guess is that this is longer than most beach goers spend in the water, with the exception of some kids who seem to spend the whole day in the water (especially in places where the water is warm).
5. As a result of the above, surfers ingest 10 times more water than swimmers or divers
As summarized here, surfers tend to ingest 10 times more water than swimmers or divers. To their exposure to pathogens in the water is much higher than other groups. The repeated, full and sometimes violent immersion in the ocean that surfer experience increases ingestion and water getting forced into the sinuses (thus the delayed nose drip).
Conclusion
The combination of more days of exposure, during some of the most polluted times, and more complete immersion and ingestion increases the total exposure of surfers to pathogens and therefore the odds of getting sick. So the next time your nose starts to drip, think about the quality of the ocean water that just sat in your head for the last several hours - hopefully it was clean!
The papers referenced below provide a more in-depth look at these issues.
References:
Dwight, R. H., D. B. Backer, et al. (2004). "Health Effects Associated With Recreational Coastal Water Use: Urban Versus Rural California." American Journal of Public Health 94(4): 565-567.
Dwight, R. H., M. V. Brinks, et al. (2007). "Beach attendance and bathing rates for Southern California beaches." Ocean & Coastal Management 50: 847-858.
Leeworthy, V. R. and P. C. Wiley (2001). Current Participation Patterns in Marine Recreation, U.S. Department of Commerce, National Oceanic and Atmospheric Administration, National Ocean Service, Special Projects. National Survey on Recreation and the Environment 2000: 53.
Nelsen, C., L. Pendleton, et al. (2007). "A Socioeconomic Study of Surfers at Trestles Beach." Shore & Beach 75(4): 32-37.
Stone, D. L., A. K. Harding, et al. (2008). "Exposure Assessment and Risk of Gastrointestinal Illness Among Surfers." Journal of Toxicology and Environmental Health, Part A 17(24): 1603-1615.
Posted by
Chad Nelsen
at
2:33 PM
|
![]()
Labels: surfer illness, water quality
Friday, June 4, 2010
Surfers vs. Beachgoers: who is using the beach
 For one year, starting in July 2008, 462 beach visitors were interviewed.
 Source: CIC Research, July 2009
In an earlier post entitled "Intercepting Surfers", I discussed the fact that surfers have a different daily pattern of beach use than typical beach goers. Surfers are more likely to use the beach in the mornings and evenings than beach goers whereas most beach goers tend to visit the beach in the middle of the day. Because studies on beach use typically focus on beach goers, they tend to sample during the middle of the day when the crowds are at their peak but at a time when surfers might be missed. It has also been assumed that there are usually more beach goers than surfers.
A recent study of beach attendance in the City of Solana Beach (San Diego) conducted over an entire year found that surfing was the most common primary purpose for being at the beach. See graphic above.
While it could be argued that some of the other categories in combination represent "beach going", this study is notable in finding that surfing is such a strong driving force for visiting beaches in the City of Solana Beach.
Posted by
Chad Nelsen
at
1:46 PM
|
![]()
Labels: beach attendance, Solana Beach, surfer visits, surfing, visitation
Sunday, February 14, 2010
Why is it so crowded in the line up: Do The Math
If you take the coast of California between San Francisco to the Mexican border, which is roughly 500 miles, and grossly estimate that there is one class “A” surf break every 50-miles, that would total 10. Then, say there is one class “B” break very 5-miles which adds 100 breaks to the total. Once again, let’s assume that there is yet another class “C” break every 5-miles to add another 100 breaks, making a grand total of 250, with, in truth, most of the surfers being drawn to the better third.
250 Surf spots
Now, let’s say that there are 500,000 active surfers in California, and that on any sunny weekend day with a 4-foot swell running, that 10% will hit the surf. Now, let’s consider that at least 1/3rd of those 250 breaks will be completely off-duty due to swell direction. That makes for 50,000 surfers sharing 250-less 83 breaks=50,000/167 which means that on average, there will be 299 surfers for each working surf break along the coast between San Francisco and the Mexican border.
299 Surfers per spot
Now let’s be real, the population is probably 2/3s in the south and 1/3 north, so the distribution at breaks would be weighted to the south. Therefore, let’s say 66% X 50,000 surfers=33,000 surfers for the working breaks in the south, and 17,000 for the working break in the north.
2/3 of those surfers live in Southern California
Of course, quantifying “the better break attracting more than their share” theory means that, let’s say, 35,000 surfers surfing the top third working breaks (56) or about 625 for each of those which leaves only 15,000 for the other 111, or 155 per.
625 surfers per spot in the South
155 surfers per spot in the North
In the real world, what actually happens is that over 500 surf Trestles during a day in roughly five shifts from dawn to dusk-the same at Malibu, and Huntington Pier and San Onofre, while most other breaks get way less.
500 surfers a day at Trestles, Malibu, Huntington & San Onofre on a good day
But any way you cut it the total mass of surfers and approximate number of surf breaks is undeniable.
This is, of course, completely theoretical and statically askew, but the numbers don’t lie. We have outgrown our supply.
From The Surfers Journal blog
Posted by
Chad Nelsen
at
10:33 AM
|
![]()
Labels: attendance, california, surfer visits, surfing, trestles, visitation
Wednesday, January 13, 2010
Measuring stoke
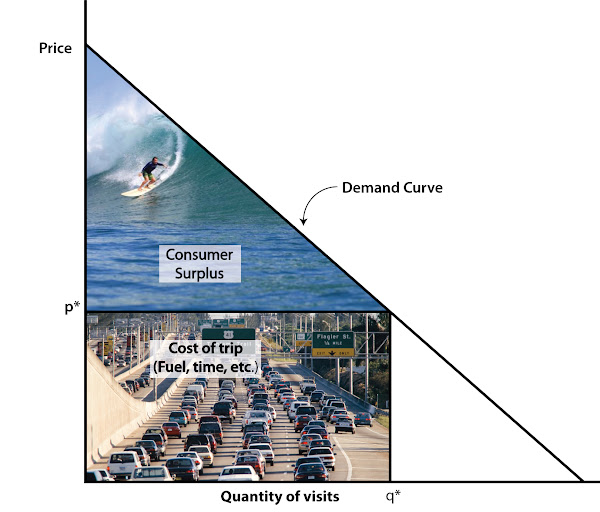
While putting a monetary value on a great day of surfing can be seen as sacrilege to some, it can also provide an important counter weight to decision making that is often based on economic contributions, jobs, etc.
Putting a value of surfing or other non-market activities (beach going, bird watching, etc.) can also be important when seeking compensation for recreation lost when beaches are closed or lost due to impacts from oil spills, water quality impairment, or coastal development.
So how how to you measure the value of a day of surfing?
Since there is typically no market for access to surfing (access is free), resource economists have to estimate these values using other methods.
One approach to capturing this value or "willingness to pay" for a day of surfing is the Travel Cost Method.
The basic premise behind the travel cost method is that visitors who live farther away from a surf spot pay a higher travel cost and take fewer trips than visitors who live closer who can afford to visit more often. By modeling travel costs and the number of trips, we can develop a demand function for recreational use and estimate an average value that you, as a surfer, put on a visit to a surf spot.
Economic theory presumes that if you spend 20 bucks on gas and three hours of your free time getting to a surf spot, that the visit is worth at least that time and financial commitment. As a result, the travel cost method measures the lower bound of this value; it could be higher.
This average value is called the consumer surplus is the difference between the maximum someone would pay for a trip and the amount actually paid. In other words, the benefit you derive above and beyond the value of your time and travel costs.
For example, in a previous post I wrote about a guy whose "willingness to pay" to spend an afternoon at Trestles was very high. Despite his high travel cost he believed it was worth it because the waves are so good. In the model schematic above, he would be found on the upper left region of the demand curve.
Posted by
Chad Nelsen
at
12:59 PM
|
![]()
Labels: consumer surplus, stoke, Travel Cost Method


